SLE Volcano Plot
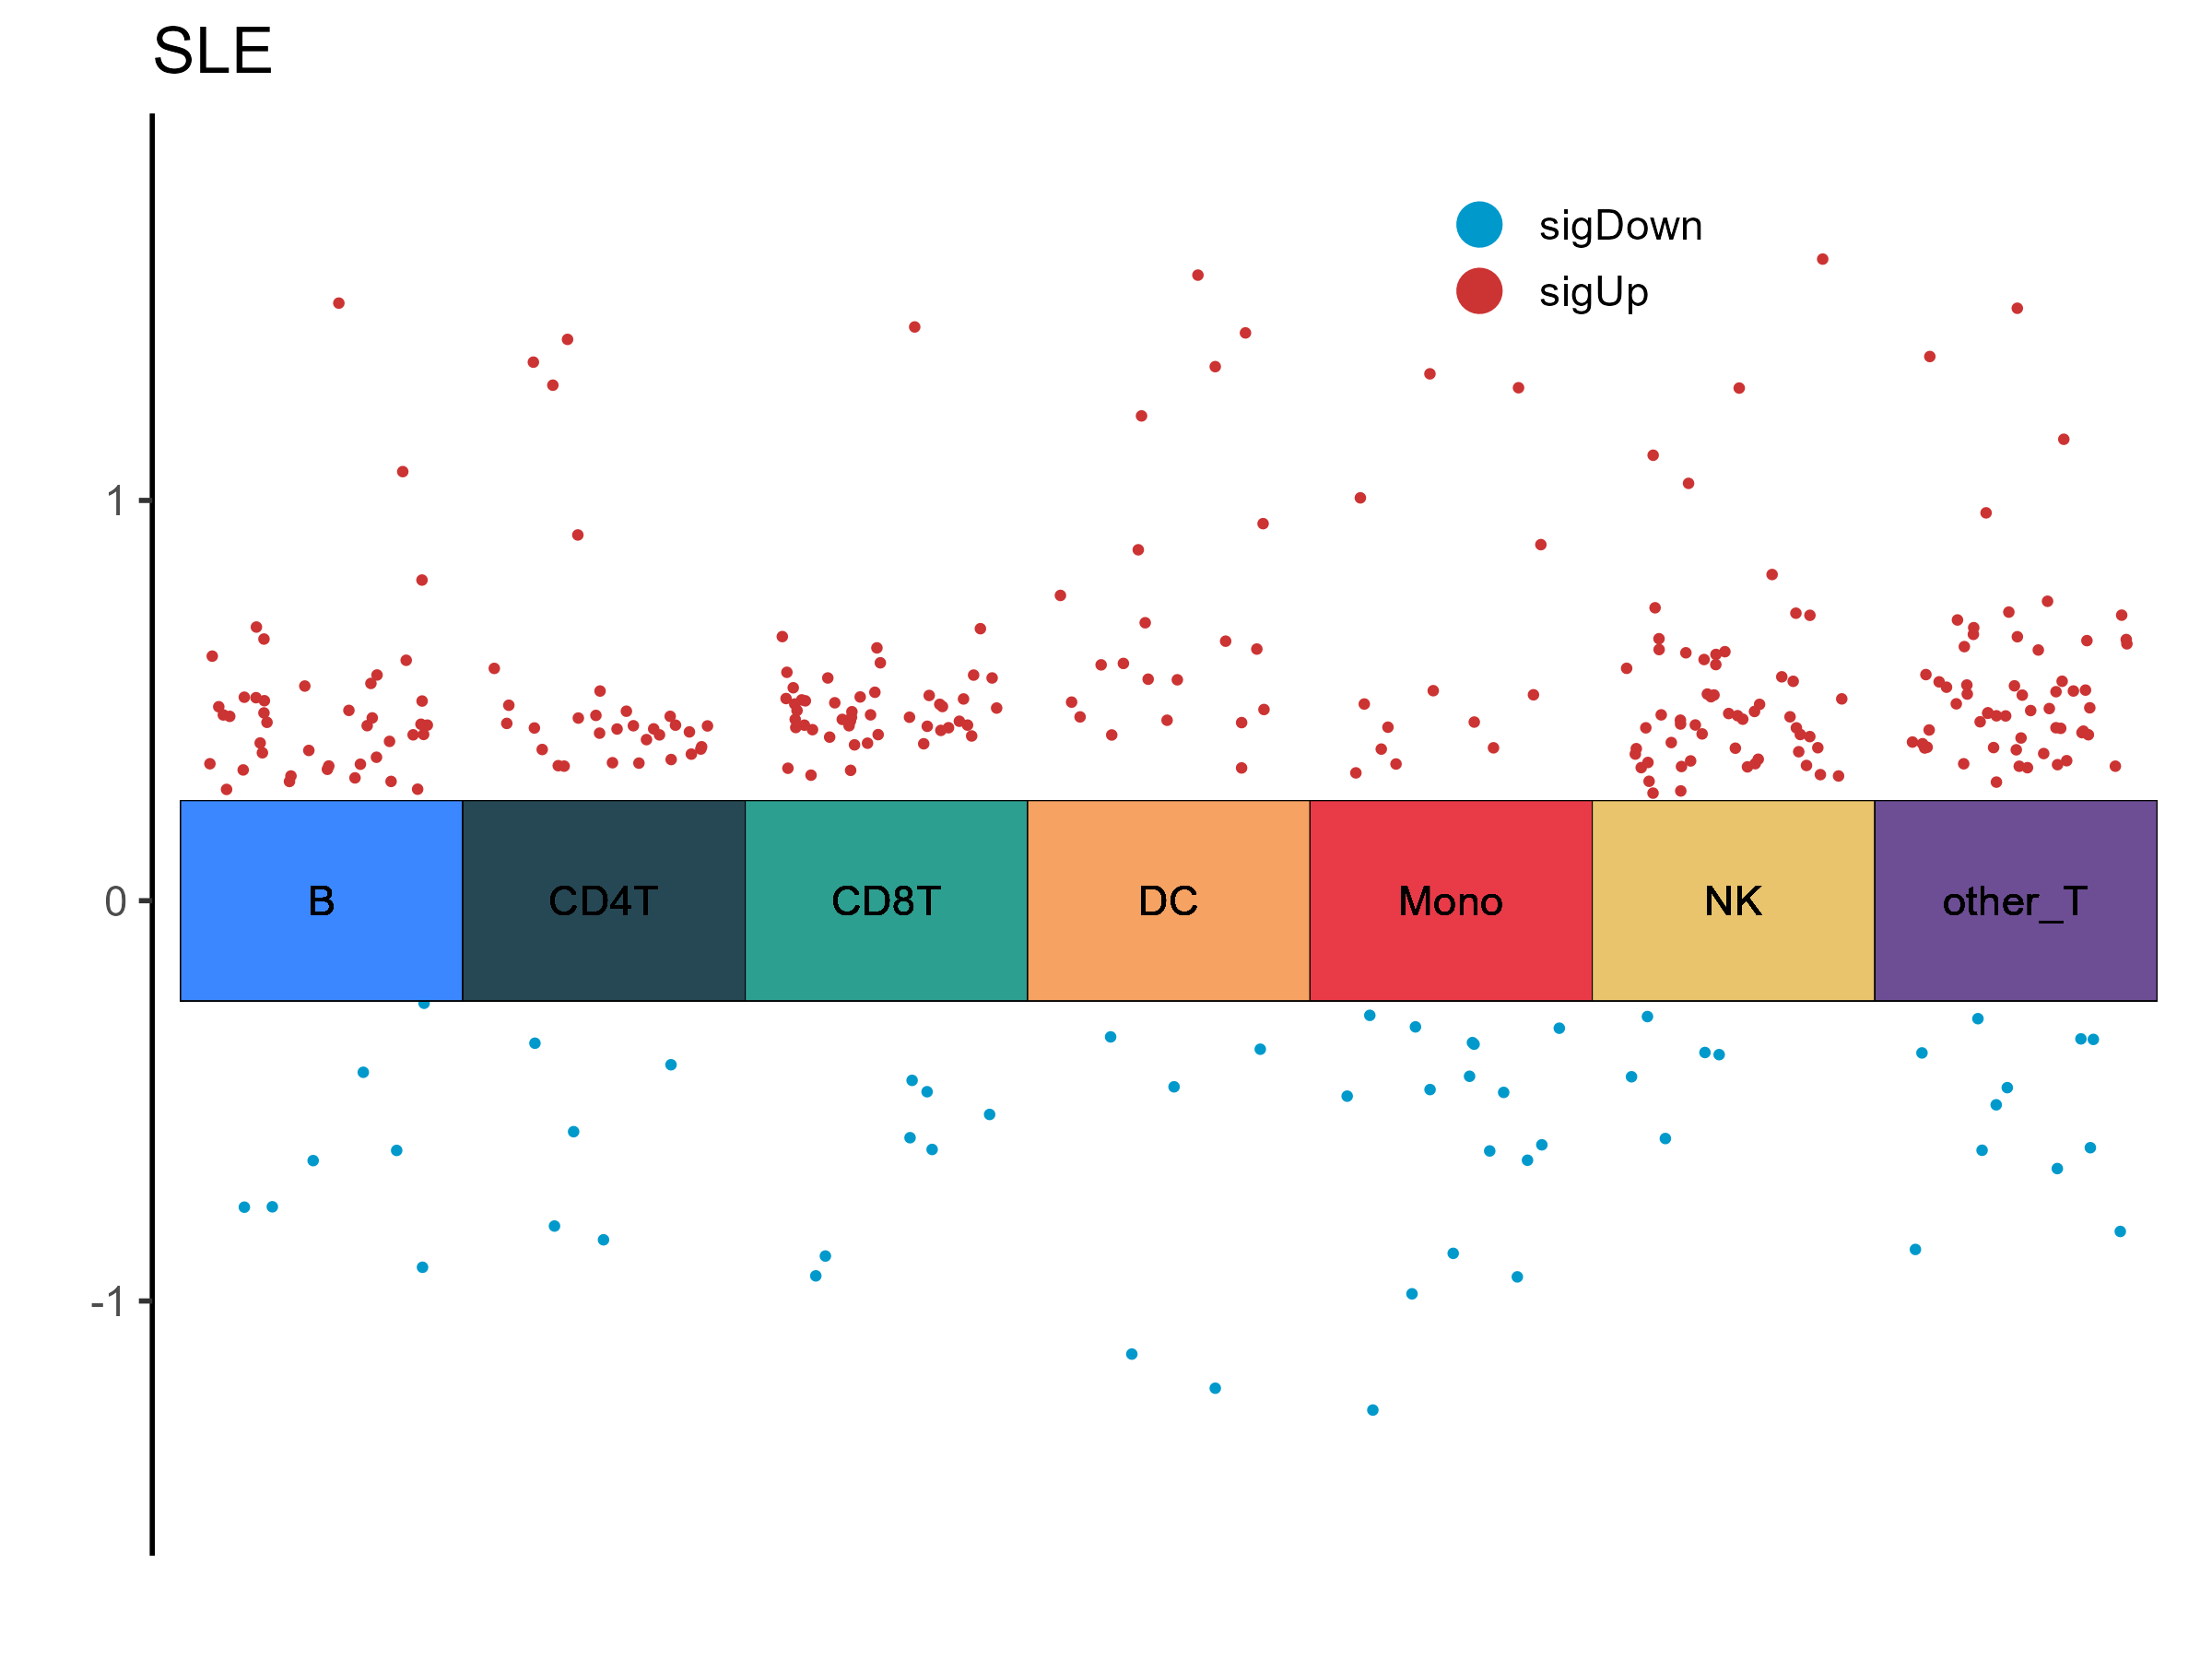
DEM Statistics (P < 0.05, |logFC| > 0.25)
| Cell Type | Up | Down | Total |
|---|---|---|---|
| B | 42 | 7 | 49 |
| other_T | 57 | 11 | 68 |
| Mono | 13 | 16 | 29 |
| NK | 56 | 5 | 61 |
| CD8T | 48 | 7 | 55 |
| DC | 21 | 5 | 26 |
| CD4T | 31 | 5 | 36 |
| Module_Name | logFC | P.Value | Cell_Type | disease | Expression |
|---|---|---|---|---|---|
| B_12_10: Hemoglobin SC Disease | 0.484567297842937 | 0.00439640485578531 | B | SLE | |
| B_14_19: Conversion from APC/C:Cdc20 to APC/C:Cdh1 in late anaphase | 0.437299697193752 | 0.00449834011148699 | B | SLE | |
| B_9_5: alpha 1-Antitrypsin | 0.563853082432485 | 0.00601253251018147 | B | SLE | |
| B_14_39: phosphatidylinositol phosphate 5-phosphatase activity | 0.469144238268537 | 0.00645384411306672 | B | SLE | |
| B_14_33: NA | 0.460512999957755 | 0.00657527132792592 | B | SLE | |
| B_9_2: ATP biosynthetic process | 0.536262705562348 | 0.00813607643122947 | B | SLE | |
| B_14_2: ubiquitin binding | 0.297965360426568 | 0.00970558583315213 | B | SLE | |
| B_13_20: Transcription Factor TFIID | 0.438634534071548 | 0.00985420095091059 | B | SLE | |
| B_14_5: carbon-carbon lyase activity | 0.336514431259284 | 0.010868113784223 | B | SLE | |
| B_10_4: tertiary granule | 0.475434664977154 | 0.0113243872276726 | B | SLE | |
| B_13_16: NA | 0.311599576690104 | 0.0116501004257351 | B | SLE | |
| B_13_12: Saccharomyces | 0.375400490416464 | 0.0118376660401938 | B | SLE | |
| B_9_4: CD4 TEM | -0.428656225801874 | 0.0122712361797281 | B | SLE | |
| B_8_1: Asparagine N-linked glycosylation | 0.507174098604095 | 0.0126289719784168 | B | SLE | |
| B_12_8: Receptors, Fibronectin | 0.398015847248568 | 0.0132862618974079 | B | SLE |