SLE Volcano Plot
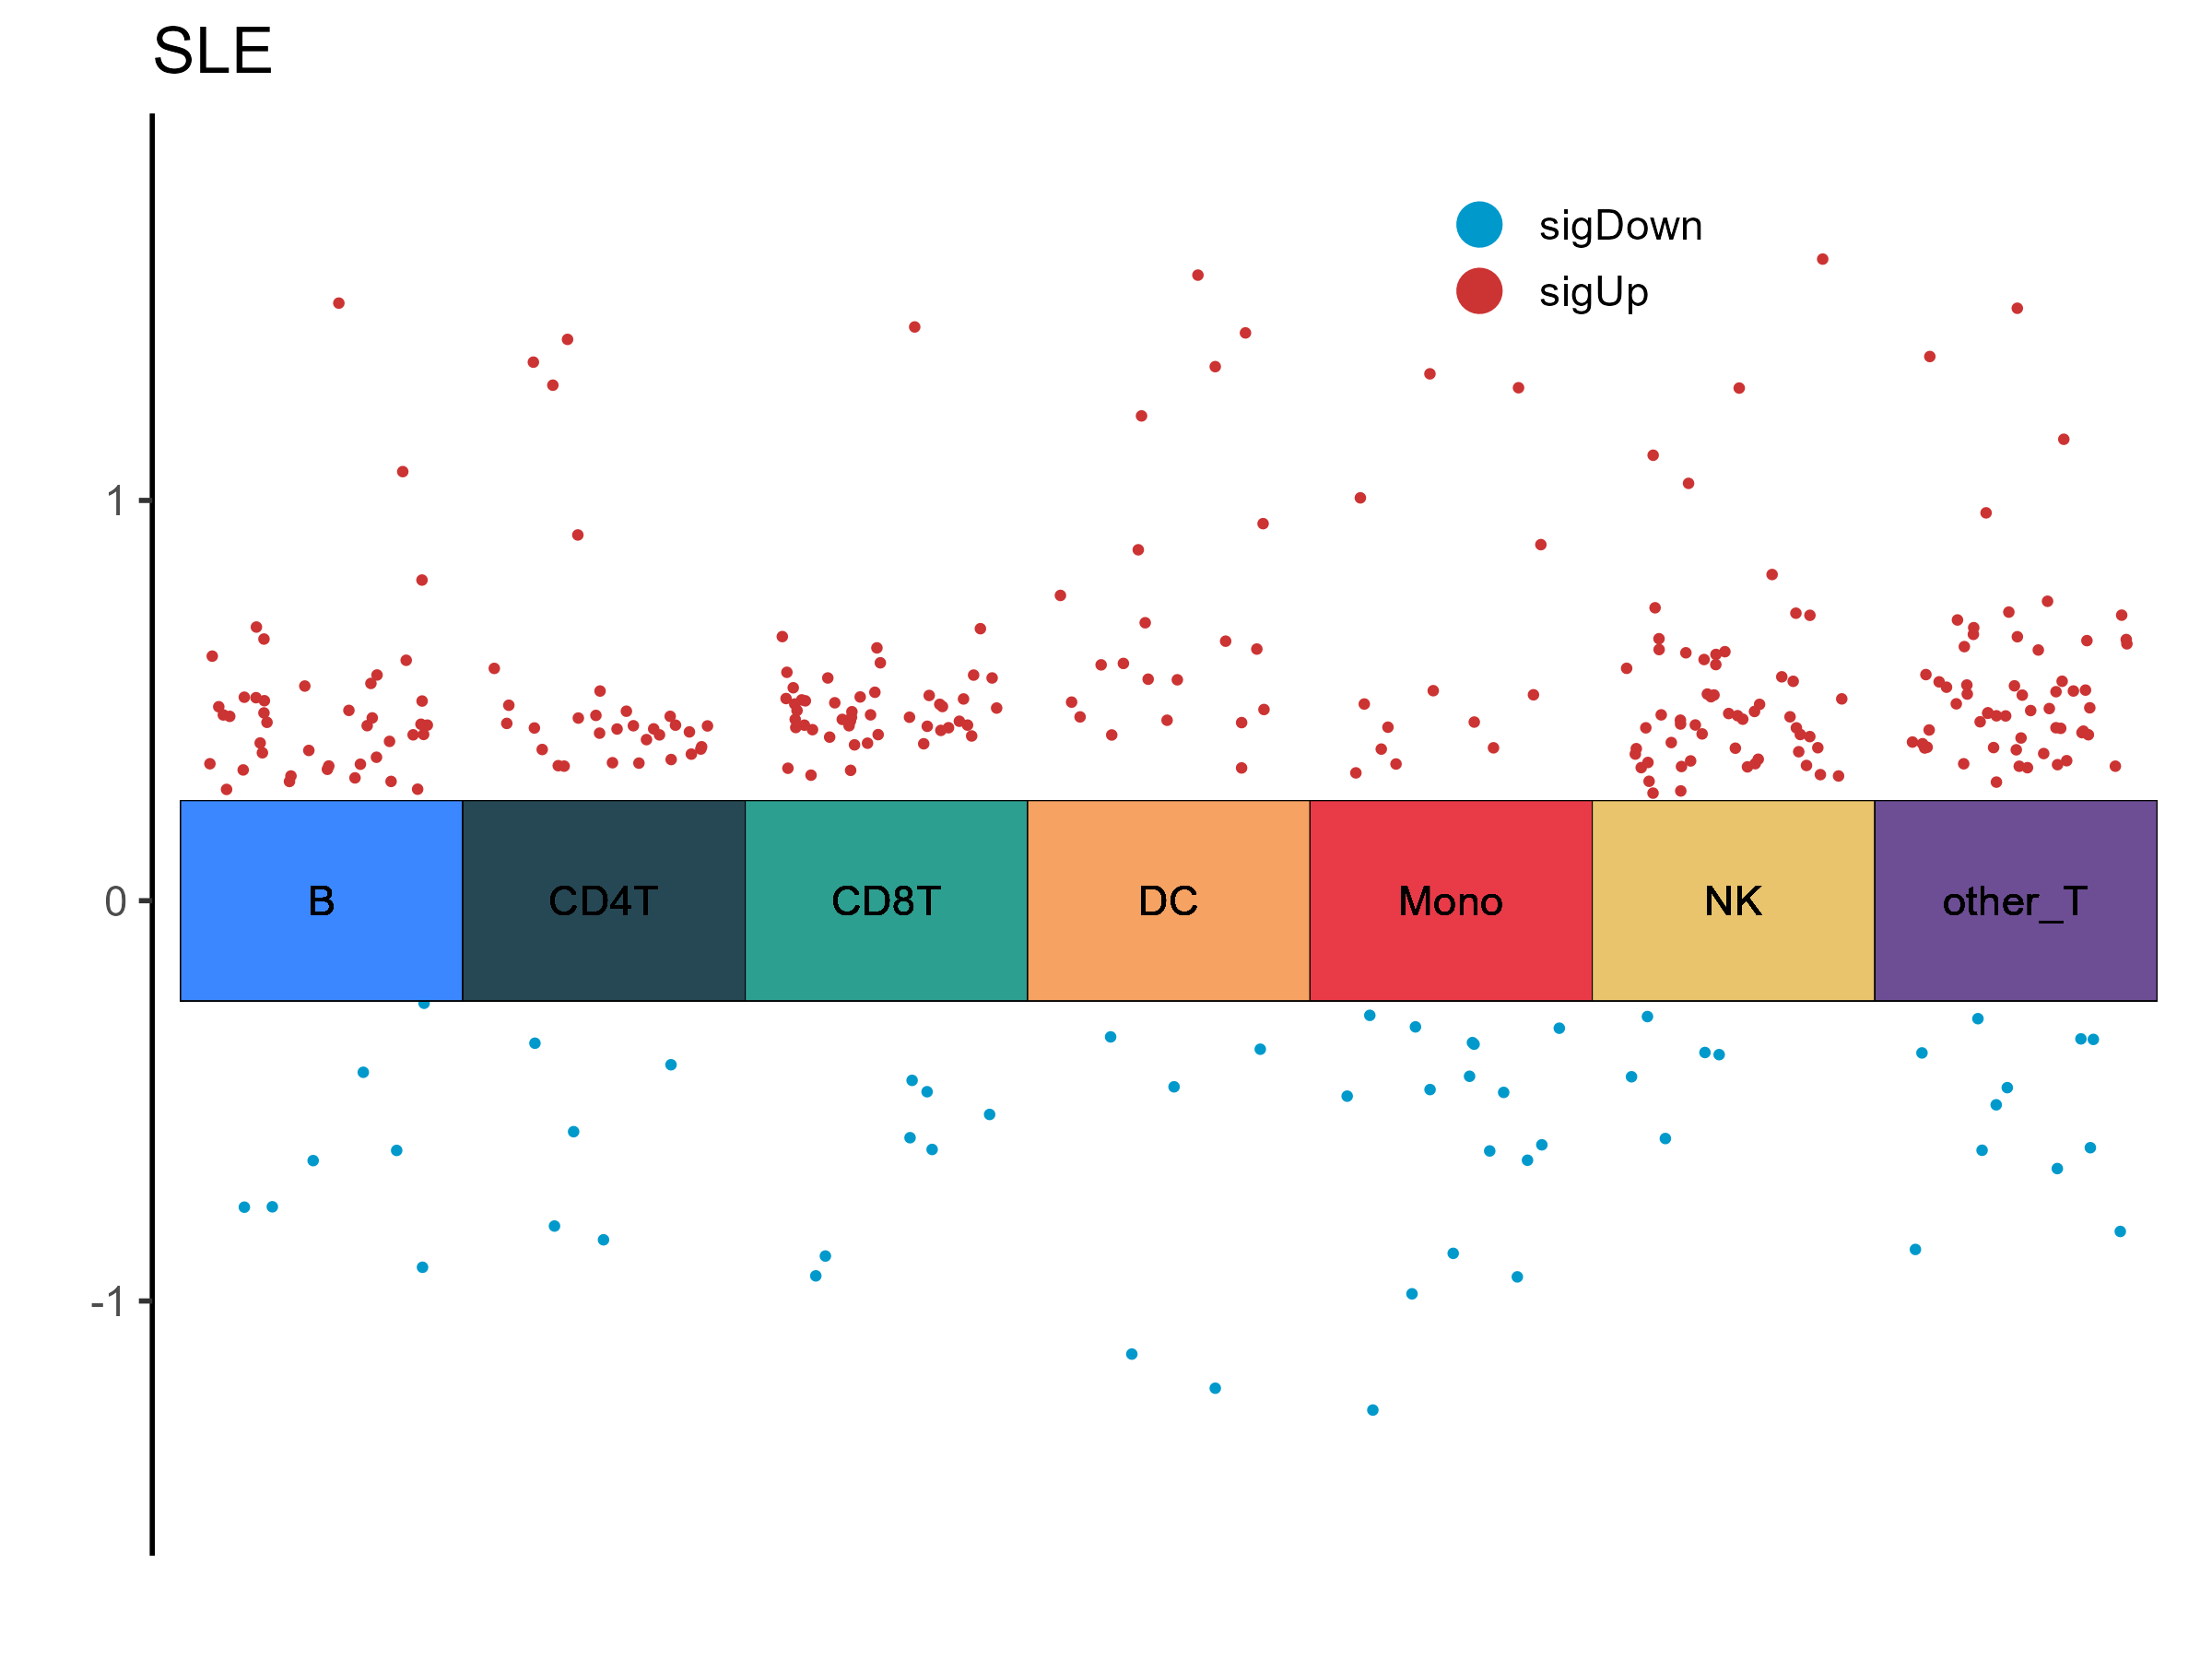
DEM Statistics (P < 0.05, |logFC| > 0.25)
| Cell Type | Up | Down | Total |
|---|---|---|---|
| B | 42 | 7 | 49 |
| other_T | 57 | 11 | 68 |
| Mono | 13 | 16 | 29 |
| NK | 56 | 5 | 61 |
| CD8T | 48 | 7 | 55 |
| DC | 21 | 5 | 26 |
| CD4T | 31 | 5 | 36 |
| Module_Name | logFC | P.Value | Cell_Type | disease | Expression |
|---|---|---|---|---|---|
| B_14_22: Processing of Capped Intron-Containing Pre-mRNA | 0.112120002516152 | 0.527951372132595 | B | SLE | |
| B_14_43: small GTPase-mediated signal transduction | 0.0928729615455839 | 0.534395753162074 | B | SLE | |
| B_10_2: mitochondrial protein-containing complex | 0.12761695152489 | 0.538436722124228 | B | SLE | |
| B_14_4: NA | -0.0798436097035662 | 0.55185118263629 | B | SLE | |
| B_12_13: ribonucleoprotein complex biogenesis | 0.0975420832821197 | 0.556247081172093 | B | SLE | |
| B_13_9: paraspeckles | 0.103385201731623 | 0.570392515816219 | B | SLE | |
| B_13_5: Spliceosomes | 0.0842517165503759 | 0.612124953364981 | B | SLE | |
| B_10_12: actin filament organization | 0.116232216077368 | 0.620073002662811 | B | SLE | |
| B_12_22: electron transfer activity | 0.103098597209386 | 0.623111135152908 | B | SLE | |
| B_14_35: NA | -0.0810641649158601 | 0.648027334619149 | B | SLE | |
| B_12_3: structural constituent of nuclear pore | -0.0655104642633964 | 0.649114608506142 | B | SLE | |
| B_11_2: RNA Helicases | 0.0698056482569748 | 0.654896831361609 | B | SLE | |
| B_13_26: Mice, Inbred NOD | 0.0759303383433287 | 0.655829668840411 | B | SLE | |
| B_13_19: FNIP-folliculin RagC/D GAP | -0.0665810543412808 | 0.694700145087125 | B | SLE | |
| B_12_11: NF-kappa B p50 Subunit | -0.0945238854611491 | 0.696409404161621 | B | SLE |